
 Dashboard


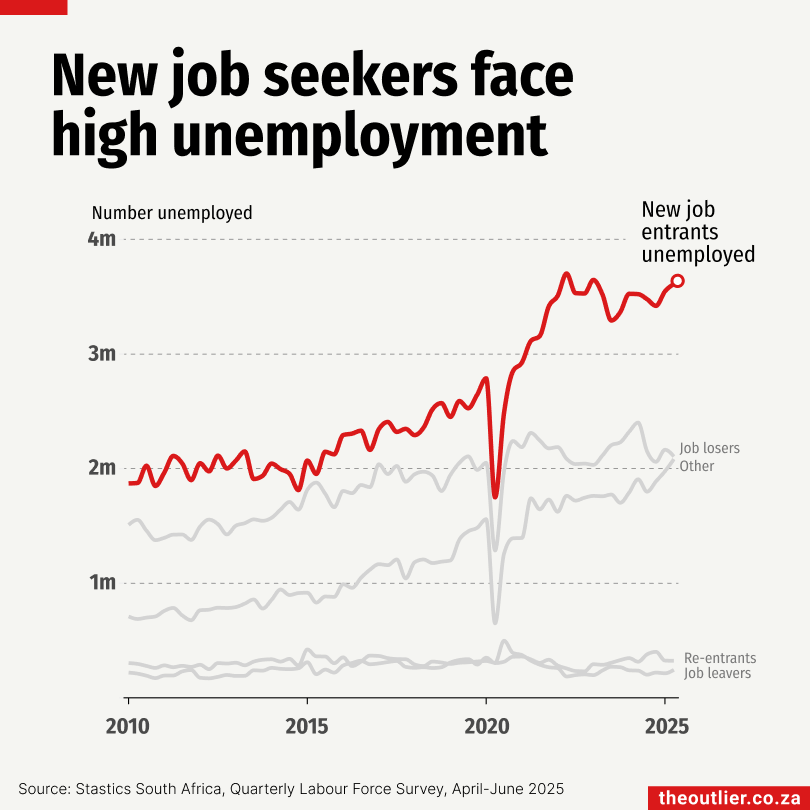
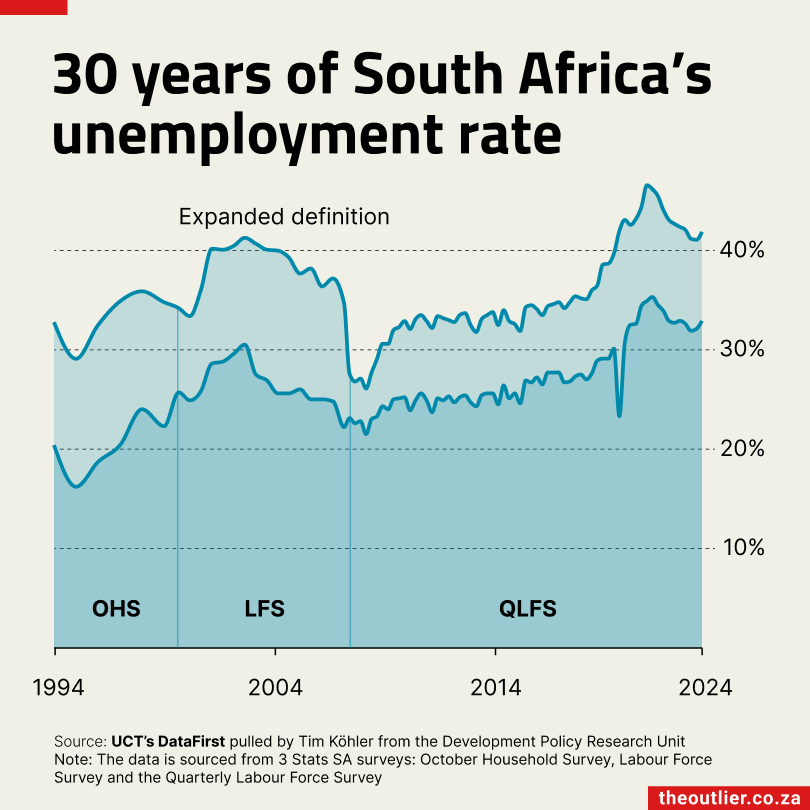
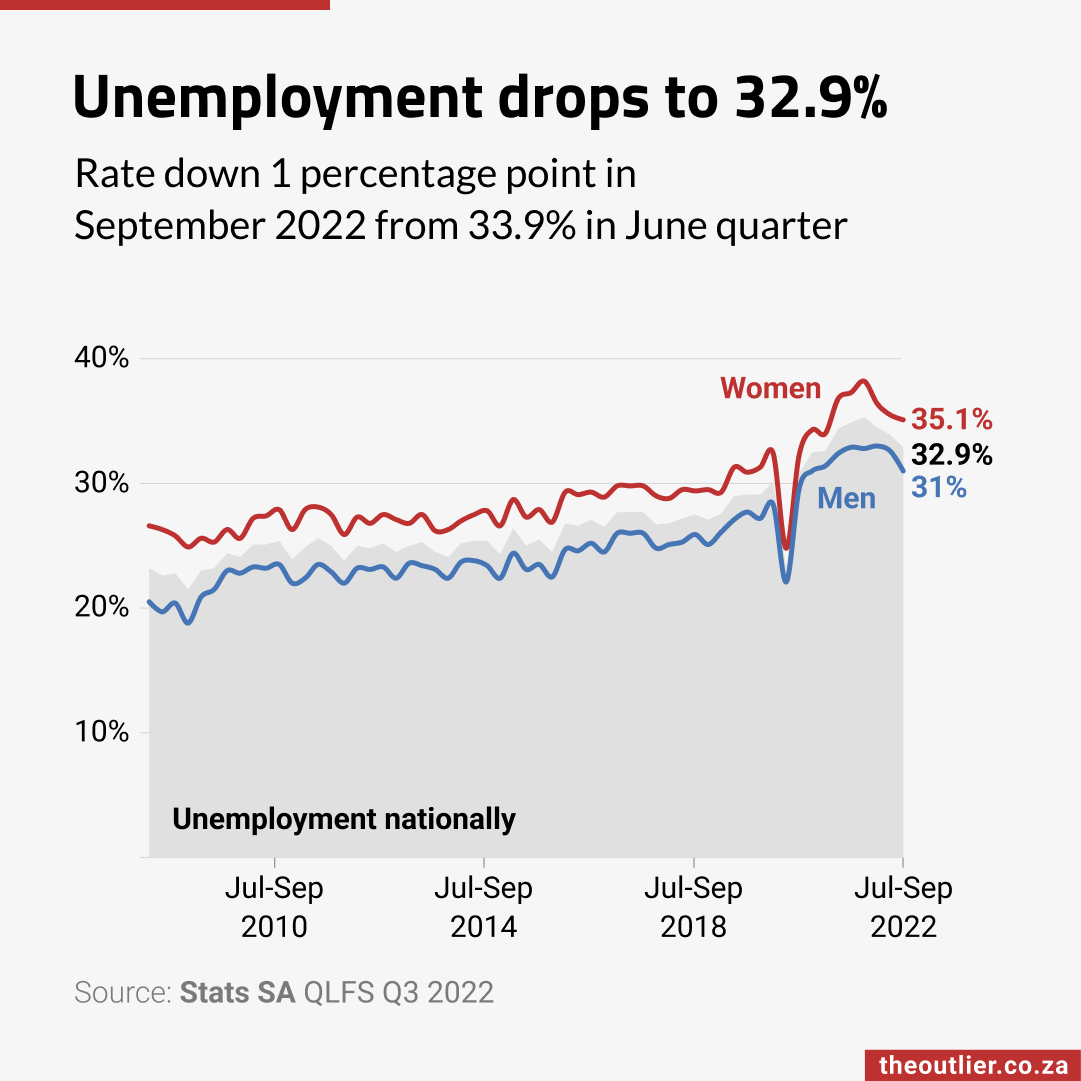
This chart is one possible view of this dataset — you'll find other chart options below if they are available. You can find the full dataset and metadata at the bottom of the page.
These charts are based on dataset DS0468 - Unemployment and the Labour Force
Statistics South Africa publishes the figures which provide the national unemployment rate as part of the Quarterly Labour Force Survey. This national survey breaks down the working age population (people between age 15-64) into two main categories - those counted as part of the labour force' and those 'outside of the labour force'. The official unemployment rate is the proportion of the labour force that is unemployed. But this rate doesn't account for the population that are of working age, but are categorised as 'outside the labour force'. ‘Discouraged workers’ - i.e people who are unemployed but could not find a job and have given up trying to, are one such category of people not accounted for in the unemployment rate.
Stats SA therefore also publishes various other ‘labour underutilisation’ (LU) measures in order to more accurately measure the labour market. These include measurements for time-related underemployment, and the ‘potential labour force’.
Note the following categories that the data is broken down into
1. Working-age population = Labour force + Outside the labour force
2. Labour force = Employed + Unemployed
3. Outside the labour force = Potential labour force + Other outside the labour force
4. Potential labour force = People who are seeking work but unavailable for it + People who are available for work, who are not actively seeking it, including 'Discouraged-job-seekers'.
- Time period covered
- 2008 to 2026
- Time-series breakdown
- Quarterly
- Geographic coverage
- South Africa
- Source
- Statistics South Africa
Preview the full dataset below.
| date | working_age_population | labour_force | employed | unemployed | outside_the_labour_force | potential_labour_force | discouraged_job-seekers | other_outside_the_labour_force | labour_force_participation_rate | employed_population_ratio_absorption | inactivity_rate | lu1-_unemployment_rate | lu2_-_combined_rate_of_unemployment_and_time-related_underemployment | lu3_-_combined_rate_of_unemployment_and_potential_labour_force | lu4_-_composite_measure_of_labour_underutilization |
|---|---|---|---|---|---|---|---|---|---|---|---|---|---|---|---|
| 2008-03-31 | 31544000 | 18808000 | 14438000 | 4371000 | 12736000 | 2089000 | 1202000 | 10647000 | 59.6 | 45.8 | 40.4 | 23.2 | 26.8 | 30.9 | 34.1 |
| 2008-06-30 | 31690000 | 18851000 | 14584000 | 4267000 | 12839000 | 1851000 | 1101000 | 10988000 | 59.5 | 46 | 40.5 | 22.6 | 26 | 29.6 | 32.6 |
| 2008-09-30 | 31839000 | 18848000 | 14549000 | 4299000 | 12991000 | 1797000 | 1093000 | 11194000 | 59.2 | 45.7 | 40.8 | 22.8 | 26.3 | 29.5 | 32.7 |
| 2008-12-31 | 31987000 | 18817000 | 14769000 | 4048000 | 13170000 | 1899000 | 1189000 | 11271000 | 58.8 | 46.2 | 41.2 | 21.5 | 24.9 | 28.7 | 31.8 |
| 2009-03-31 | 32135000 | 18982000 | 14616000 | 4366000 | 13153000 | 2007000 | 1233000 | 11146000 | 59.1 | 45.5 | 40.9 | 23 | 26.4 | 30.4 | 33.4 |
| 2009-06-30 | 32285000 | 18698000 | 14357000 | 4341000 | 13587000 | 2343000 | 1536000 | 11244000 | 57.9 | 44.5 | 42.1 | 23.2 | 26.9 | 31.8 | 35 |
| 2009-09-30 | 32435000 | 18306000 | 13830000 | 4476000 | 14129000 | 2602000 | 1646000 | 11527000 | 56.4 | 42.6 | 43.6 | 24.5 | 28.3 | 33.9 | 37.2 |
| 2009-12-31 | 32584000 | 18402000 | 13973000 | 4429000 | 14182000 | 2634000 | 1726000 | 11548000 | 56.5 | 42.9 | 43.5 | 24.1 | 27.5 | 33.6 | 36.6 |
| 2010-03-31 | 32732000 | 18410000 | 13797000 | 4612000 | 14323000 | 2781000 | 1890000 | 11541000 | 56.2 | 42.2 | 43.8 | 25.1 | 28.4 | 34.9 | 37.8 |
| 2010-06-30 | 32882000 | 18431000 | 13809000 | 4622000 | 14451000 | 2891000 | 1960000 | 11561000 | 56.1 | 42 | 43.9 | 25.1 | 28.3 | 35.2 | 38 |